Operations intelligence puts the data Tampa's largest organizations collect to work. Clinical records, freight manifests, financial transactions, regulatory filings. Most of that data is siloed, and the people who need it are still building reports by hand every week.
We build operations intelligence systems that pull the data together, surface the signals that matter, and deliver insight to the people who act on it.
The challenge for Tampa's enterprise and mid-market companies is not a lack of data. It is that the data lives in a dozen different systems, none of which talk to each other. Getting a clear picture of operations requires someone to pull it all together manually, and that person is doing it instead of something more valuable.
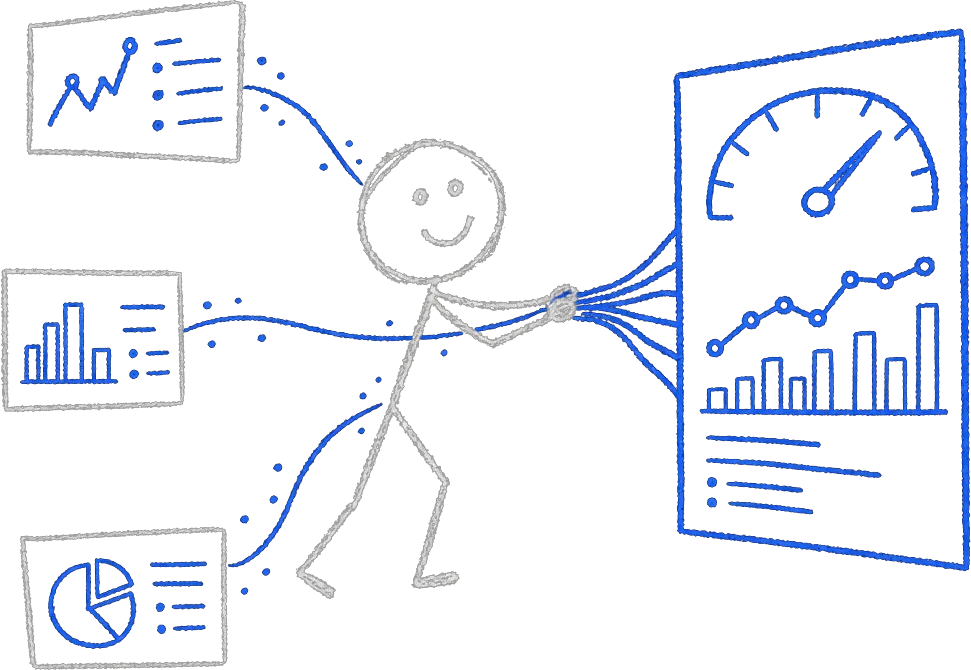
We automate the assembly. We build the connections, apply AI to interpret the patterns, and deliver a view of your operation that is current, accurate, and available to the right people.
Which Tampa Sectors Use Operations Intelligence?
Each industry in Tampa has distinct data challenges. Here is how we address them.
Healthcare and hospital systems+
Patient throughput analytics, bed capacity forecasting, staff productivity metrics, and quality measure reporting across multi-site Tampa Bay networks surface automatically so administrators act on current data. See the service →
Financial services and investment firms+
Portfolio performance dashboards, risk flag reporting, compliance audit trails, and client profitability analysis by advisor deliver without an analyst assembling them. See the service →
Logistics and freight near Port Tampa Bay+
Shipment on-time performance, cost-per-mile trending, carrier scorecard automation, and exception pattern analysis give Tampa freight operations the visibility they need without manual report building.
Real estate and property management portfolios+
Occupancy rate dashboards, maintenance cost tracking, rent collection reporting, and lease expiration forecasting across large Tampa Bay portfolios run automatically.
Professional services and consulting firms+
Utilization rate reporting, project margin analysis, client retention metrics, and pipeline-to-revenue tracking give firm leaders the visibility needed to manage a growing practice. See the service →
Technology and SaaS companies in Tampa Bay+
Product usage analytics, support ticket volume trends, resolution time reporting, and churn risk indicators by account surface without engineering time spent on internal tooling.
What Do We Deliver?
Automated reporting pipelines replacing manual data pulls+
Reports that currently require someone to pull from six systems deliver automatically. Executive time is not spent waiting for data. See the service →
Executive dashboards from live data sources+
Tampa leadership teams see current operational metrics without a weekly report cycle. Numbers are as current as the underlying systems.
AI document processing for enterprise paperwork+
High-volume clinical records, financial filings, and logistics documents are read, key fields extracted, and routed without manual review of each one. See the service →
Anomaly detection with threshold alerts+
When a Tampa Bay metric drifts outside the range you set, the right person is notified by email or text before a small problem becomes a large one.
Natural language query tools for non-technical staff+
Operations staff ask questions about business data in plain language and get an answer without running a manual report or waiting for the analyst. See the service →
Cross-department data reconciliation+
Discrepancies between Tampa enterprise systems surface before they become audit findings or billing disputes. See the service →
Integration with your existing BI tools+
We build into the platforms Tampa enterprises already use: Tableau, Power BI, Looker, or a new reporting layer we configure from scratch.
Common Questions
We have multiple enterprise systems that do not connect. How do you handle data integration?
This is the core of operations intelligence work. We build data pipelines that pull from your source systems through APIs, database connections, or scheduled file extracts, then normalize the data into a unified layer for reporting.
Can you work with systems that contain HIPAA or financial compliance data?
Yes. We design data pipelines and reporting systems with your compliance requirements built in from the start. Data handling, access controls, and audit logging are part of the design, not an afterthought.
How is this different from a BI tool we could buy and configure ourselves?
BI tools require your team to build and maintain the pipelines, models, and dashboards. We do that work for you and deliver a system that runs without a data engineer on your staff. You also get AI layers that go beyond what standard BI tools offer.
Outcome
01Real-time operational visibility across departments.
02Reporting that runs automatically without staff effort.
03Faster detection of cost overruns, quality issues, and exceptions.
04Better decisions driven by accurate, current data.